SA CloudRegimes GC.5min 1.12.2026 OVERNIGHTSignal Architect™ — Developer Note
These daily posts are intentional.
They are designed to help potential users visually observe consistency—not just in outcomes, but in process—across multiple futures products, market conditions, and timeframes, using the Stop Hunt Indicator alongside my proprietary Signal Architect™ framework.
The goal is simple:
To show how structure, behavior, and probability repeat—every day—despite a constantly changing market.
If you follow these posts over time, you will begin to recognize that:
• The same behaviors appear across different futures contracts
• The same reactions occur on multiple timeframes
• The same structural traps and stop events repeat regardless of volatility regime
That consistency is not coincidence.
Consistency is the signal.
Over time, that consistency should become familiar—
and familiarity should become your edge.
________________________________________
🧠 What You’re Seeing (And Why It Matters)
This indicator includes a limited visual preview of a proprietary power signal I have personally developed and refined across:
• Futures
• Algorithmic trading systems
• Options structure
• Equity market behavior
Every tool I release is built around one core principle:
Clarity of direction without over-promising or over-fitting.
That is why all Signal Architect™ tools emphasize:
• Market structure first
• High-probability directional context
• Clear, visual risk framing
• No predictive claims
• No curve-fit illusions
What you see publicly is not the full system—only controlled, educational previews meant to demonstrate how structure and probability align in real markets.
________________________________________
📊 Background & Scope
Over the years, I have personally developed 800+ programs, including:
• Equity systems
• Futures strategies
• Options structure tools
• Dividend & income frameworks
• Portfolio construction and allocation logic
This includes 40+ Nasdaq-100 trading bots, several operating under extremely strict rule-sets and controlled deployment conditions.
Nothing shared publicly represents my complete internal framework.
Public posts exist for education, observation, and pattern recognition—not signals, not advice, and not promises.
________________________________________
🤝 For Those Who Find Value
If these daily posts help you see the market more clearly:
• Follow, boost, and share my scripts, Ideas, and MINDS posts
• Feel free to message me directly with questions or build requests
• Constructive feedback and collaboration are always welcome
For traders who want to go deeper, optional memberships may include:
• Additional signal access
• Early previews
• Occasional free tools and upgrades
🔗 Membership & Signals:
trianchor.gumroad.com
________________________________________
⚠️ Final Note
Everything published publicly is educational and analytical only.
Markets carry risk.
Discipline, patience, and risk management always come first.
Watch the consistency.
Study the structure.
Let the market repeat itself.
— Signal Architect™
________________________________________
🔗 Personally Developed GPT Tools
• AuctionFlow GPT
chatgpt.com
• Signal Architect™ Gamma Desk – Market Intelligence
chatgpt.com
• Gamma Squeeze Watchtower™
chatgpt.com
SA CloudRegimes + HLC3 Reclaim + CONF% (VWAP Always-On)
Purpose:
This is a market-regime + trigger engine. It paints cloud zones to show what the market is doing (expanding vs contracting, bullish vs bearish) and then fires reclaim signals when price confirms continuation via HLC3 reclaim + wick reclaim behavior.
What makes it different
VWAP is always enforced (session VWAP when available; otherwise a rolling VWAP proxy).
It separates regime (cloud) from execution (signal).
It gives a real-time confirmation score (CONF%) so you can filter out low-quality setups.
1) The 4 Cloud Zones (Regimes)
Each cloud represents a behavioral state. You don’t “guess direction” inside the cloud — you use the cloud to understand what kind of market you’re in, then you wait for the reclaim trigger.
🟩 GREEN Cloud — Bullish Expansion (Uptrend continuation)
Meaning: Trend is aligned and volatility/energy is expanding upward.
Conditions (conceptually):
Trend stack bullish: SMA3 > SMA8 > SMA20 > SMA50
Price above VWAP
Momentum/pressure supportive: W%R bullish, PFE bullish
Range behavior indicates expansion
How to trade it:
Best for: continuation longs
Wait for: Bull reclaim trigger (triangle up) to enter
Risk: false continuation late in the move (use CONF% + wick gate)
💗 PINK Cloud — Bearish Contraction in an Uptrend (Bull pullback / hedge phase)
Meaning: The market is still in an uptrend, but it is pulling back and compressing (often a hedge/unwind pause before continuation).
Conditions:
Trend still bullish (uptrend stack)
Price remains above VWAP
W%R is oversold, PFE weak → indicating pullback pressure
Range indicates contraction
How to trade it:
Best for: “buy-the-pullback” continuation
Wait for: Bull reclaim trigger after the pullback stabilizes
This is your “reload zone” — don’t long blindly; let reclaim confirm.
🟥 RED Cloud — Bearish Expansion (Downtrend continuation)
Meaning: Trend is aligned bearish and volatility/energy is expanding downward.
Conditions:
Trend stack bearish: SMA3 < SMA8 < SMA20 < SMA50
Price below VWAP
W%R oversold + PFE weak/negative
Range behavior indicates expansion
How to trade it:
Best for: continuation shorts
Wait for: Bear reclaim trigger (triangle down) to enter
Risk: late-stage selling → use CONF% + wick gate.
🟩 (Light Green) Cloud — Bullish Contraction in a Downtrend (Bear pullback / bounce phase)
Meaning: The market is still in a downtrend, but it’s bouncing and compressing (often the pause before continuation lower).
Conditions:
Downtrend stack remains intact
Price remains below VWAP
W%R improving / PFE stabilizing
Range indicates contraction
How to trade it:
Best for: sell-the-bounce continuation
Wait for: Bear reclaim trigger to confirm the bounce is ending.
2) Zone Signals (G / P / R / LG markers)
These are zone-entry markers that fire only on the first bar when a zone turns on.
G = Green Zone started (bull expansion)
P = Pink Zone started (bear contraction inside uptrend)
R = Red Zone started (bear expansion)
LG = Light Green Zone started (bull contraction inside downtrend)
How to use them:
These are context markers, not trade entries.
They tell you: “We just entered a new regime. Now wait for reclaim.”
3) The Actual Trade Triggers: “Reclaim” Signals (RECL triangles)
The triangle “RECL” signals are your execution triggers.
Bull Reclaim (Triangle Up)
Fires only when the system believes the market is in a bullish regime (Green or Pink) and then sees:
A bull candle
A cross back above HLC3
A prior-bar reclaim wick (optional but recommended)
Interpretation:
Pullback resolved → price reclaimed balance (HLC3) → continuation likely.
Bear Reclaim (Triangle Down)
Fires only when the system believes the market is in a bearish regime (Red or Light Green) and then sees:
A bear candle
A cross back below HLC3
A prior-bar reclaim wick (optional)
Interpretation:
Bounce resolved → price lost balance (HLC3) → continuation lower likely.
4) CONF% Bubble (Real-Time Probability Filter)
Whenever a reclaim signal fires, the script calculates a confirmation score (0–100) using weighted factors:
Trend alignment
VWAP alignment
Zone alignment
HLC3 reclaim cross
Wick reclaim gate (if enabled)
W%R alignment
PFE alignment
Default filter
Bubble only prints if CONF% ≥ 40%
You can raise it if you want fewer, cleaner trades:
50–60% = fewer but higher quality
70%+ = very selective
How to use CONF% properly
It’s not “win rate.”
It’s a confluence meter: “How many of my conditions are aligned right now?”
Use it as a trade permission layer.
5) Recommended Workflow (The Correct Way)
Step 1 — Identify the active cloud
Green/ Pink = you’re looking for long continuation
Red/ Light Green = you’re looking for short continuation
Step 2 — Let the pullback finish
Pink and Light Green are pullback/bounce phases.
Don’t jump in — wait.
Step 3 — Take ONLY reclaim triggers
Triangle up/down is your “go” signal.
Step 4 — Use CONF% to filter
If CONF% is low, skip.
If CONF% is strong, you have confluence.
6) Best Timeframes (Practical)
This tool works on many charts, but it shines where regimes develop clearly.
Best (most stable)
15m
1H
2H
4H
Faster (more signals, more noise)
3m / 5m can work, but you’ll need:
tighter tickSize accuracy
slightly looser thresholds
higher CONF% filtering
7) Key Settings You’ll Actually Adjust
If you don’t see many clouds on a timeframe:
Lower pfeBullThresh (ex: 35 → 30)
Lower expansionMin (60 → 55)
Raise contractionMax (35 → 40)
If you see too many weak signals:
Raise minConfirmPct (40 → 50/60)
Keep usePrevWickGate = true
8) Simple Interpretation Cheat Sheet
Green: bull continuation environment → wait for bull reclaim
Pink: pullback in bull trend → best “reload” → wait for bull reclaim
Red: bear continuation environment → wait for bear reclaim
Light Green: bounce in bear trend → best “sell bounce” → wait for bear reclaim
在腳本中搜尋"Pattern recognition"

Signal Architect Stop-Hunt !GC HOUR.1.12.2026 AM Signal Architect™ — Developer Note
These daily posts are intentional.
They are designed to help potential users visually observe consistency—not just in outcomes, but in process—across multiple futures products, market conditions, and timeframes, using the Stop Hunt Indicator alongside my proprietary Signal Architect™ framework.
The goal is simple:
To show how structure, behavior, and probability repeat—every day—despite a constantly changing market.
If you follow these posts over time, you will begin to recognize that:
• The same behaviors appear across different futures contracts
• The same reactions occur on multiple timeframes
• The same structural traps and stop events repeat regardless of volatility regime
That consistency is not coincidence.
Consistency is the signal.
Over time, that consistency should become familiar—
and familiarity should become your edge.
________________________________________
🧠 What You’re Seeing (And Why It Matters)
This indicator includes a limited visual preview of a proprietary power signal I have personally developed and refined across:
• Futures
• Algorithmic trading systems
• Options structure
• Equity market behavior
Every tool I release is built around one core principle:
Clarity of direction without over-promising or over-fitting.
That is why all Signal Architect™ tools emphasize:
• Market structure first
• High-probability directional context
• Clear, visual risk framing
• No predictive claims
• No curve-fit illusions
What you see publicly is not the full system—only controlled, educational previews meant to demonstrate how structure and probability align in real markets.
________________________________________
📊 Background & Scope
Over the years, I have personally developed 800+ programs, including:
• Equity systems
• Futures strategies
• Options structure tools
• Dividend & income frameworks
• Portfolio construction and allocation logic
This includes 40+ Nasdaq-100 trading bots, several operating under extremely strict rule-sets and controlled deployment conditions.
Nothing shared publicly represents my complete internal framework.
Public posts exist for education, observation, and pattern recognition—not signals, not advice, and not promises.
________________________________________
🤝 For Those Who Find Value
If these daily posts help you see the market more clearly:
• Follow, boost, and share my scripts, Ideas, and MINDS posts
• Feel free to message me directly with questions or build requests
• Constructive feedback and collaboration are always welcome
For traders who want to go deeper, optional memberships may include:
• Additional signal access
• Early previews
• Occasional free tools and upgrades
🔗 Membership & Signals:
trianchor.gumroad.com
________________________________________
⚠️ Final Note
Everything published publicly is educational and analytical only.
Markets carry risk.
Discipline, patience, and risk management always come first.
Watch the consistency.
Study the structure.
Let the market repeat itself.
— Signal Architect™
________________________________________
🔗 Personally Developed GPT Tools
• AuctionFlow GPT
chatgpt.com
• Signal Architect™ Gamma Desk – Market Intelligence
chatgpt.com
• Gamma Squeeze Watchtower™
chatgpt.com

Signal Architect Stop-Hunt !GC. 15 MIN. 1.12.2026 . AM SESSIONSignal Architect™ — Developer Note
These daily posts are intentional.
They are designed to help potential users visually observe consistency—not just in outcomes, but in process—across multiple futures products, market conditions, and timeframes, using the Stop Hunt Indicator alongside my proprietary Signal Architect™ framework.
The goal is simple:
To show how structure, behavior, and probability repeat—every day—despite a constantly changing market.
If you follow these posts over time, you will begin to recognize that:
• The same behaviors appear across different futures contracts
• The same reactions occur on multiple timeframes
• The same structural traps and stop events repeat regardless of volatility regime
That consistency is not coincidence.
Consistency is the signal.
Over time, that consistency should become familiar—
and familiarity should become your edge.
________________________________________
🧠 What You’re Seeing (And Why It Matters)
This indicator includes a limited visual preview of a proprietary power signal I have personally developed and refined across:
• Futures
• Algorithmic trading systems
• Options structure
• Equity market behavior
Every tool I release is built around one core principle:
Clarity of direction without over-promising or over-fitting.
That is why all Signal Architect™ tools emphasize:
• Market structure first
• High-probability directional context
• Clear, visual risk framing
• No predictive claims
• No curve-fit illusions
What you see publicly is not the full system—only controlled, educational previews meant to demonstrate how structure and probability align in real markets.
________________________________________
📊 Background & Scope
Over the years, I have personally developed 800+ programs, including:
• Equity systems
• Futures strategies
• Options structure tools
• Dividend & income frameworks
• Portfolio construction and allocation logic
This includes 40+ Nasdaq-100 trading bots, several operating under extremely strict rule-sets and controlled deployment conditions.
Nothing shared publicly represents my complete internal framework.
Public posts exist for education, observation, and pattern recognition—not signals, not advice, and not promises.
________________________________________
🤝 For Those Who Find Value
If these daily posts help you see the market more clearly:
• Follow, boost, and share my scripts, Ideas, and MINDS posts
• Feel free to message me directly with questions or build requests
• Constructive feedback and collaboration are always welcome
For traders who want to go deeper, optional memberships may include:
• Additional signal access
• Early previews
• Occasional free tools and upgrades
🔗 Membership & Signals:
trianchor.gumroad.com
________________________________________
⚠️ Final Note
Everything published publicly is educational and analytical only.
Markets carry risk.
Discipline, patience, and risk management always come first.
Watch the consistency.
Study the structure.
Let the market repeat itself.
— Signal Architect™
________________________________________
🔗 Personally Developed GPT Tools
• AuctionFlow GPT
chatgpt.com
• Signal Architect™ Gamma Desk – Market Intelligence
chatgpt.com
• Gamma Squeeze Watchtower™
chatgpt.com

Signal Architect Stop-Hunt GOLD 5MINSignal Architect™ — Developer Note
These daily posts are intentional.
They are designed to help potential users visually observe consistency—not just in outcomes, but in process—across multiple futures products, market conditions, and timeframes, using the Stop Hunt Indicator alongside my proprietary Signal Architect™ framework.
The goal is simple:
To show how structure, behavior, and probability repeat—every day—despite a constantly changing market.
If you follow these posts over time, you will begin to recognize that:
• The same behaviors appear across different futures contracts
• The same reactions occur on multiple timeframes
• The same structural traps and stop events repeat regardless of volatility regime
That consistency is not coincidence.
Consistency is the signal.
Over time, that consistency should become familiar—
and familiarity should become your edge.
________________________________________
🧠 What You’re Seeing (And Why It Matters)
This indicator includes a limited visual preview of a proprietary power signal I have personally developed and refined across:
• Futures
• Algorithmic trading systems
• Options structure
• Equity market behavior
Every tool I release is built around one core principle:
Clarity of direction without over-promising or over-fitting.
That is why all Signal Architect™ tools emphasize:
• Market structure first
• High-probability directional context
• Clear, visual risk framing
• No predictive claims
• No curve-fit illusions
What you see publicly is not the full system—only controlled, educational previews meant to demonstrate how structure and probability align in real markets.
________________________________________
📊 Background & Scope
Over the years, I have personally developed 800+ programs, including:
• Equity systems
• Futures strategies
• Options structure tools
• Dividend & income frameworks
• Portfolio construction and allocation logic
This includes 40+ Nasdaq-100 trading bots, several operating under extremely strict rule-sets and controlled deployment conditions.
Nothing shared publicly represents my complete internal framework.
Public posts exist for education, observation, and pattern recognition—not signals, not advice, and not promises.
________________________________________
🤝 For Those Who Find Value
If these daily posts help you see the market more clearly:
• Follow, boost, and share my scripts, Ideas, and MINDS posts
• Feel free to message me directly with questions or build requests
• Constructive feedback and collaboration are always welcome
For traders who want to go deeper, optional memberships may include:
• Additional signal access
• Early previews
• Occasional free tools and upgrades
🔗 Membership & Signals:
trianchor.gumroad.com
________________________________________
⚠️ Final Note
Everything published publicly is educational and analytical only.
Markets carry risk.
Discipline, patience, and risk management always come first.
Watch the consistency.
Study the structure.
Let the market repeat itself.
— Signal Architect™
________________________________________
🔗 Personally Developed GPT Tools
• AuctionFlow GPT
chatgpt.com
• Signal Architect™ Gamma Desk – Market Intelligence
chatgpt.com
• Gamma Squeeze Watchtower™
chatgpt.com

Signal Architect Stop-Hunt Signal Architect™ — Developer Note
These daily posts are intentional.
They are designed to help potential users visually observe consistency—not just in outcomes, but in process—across multiple futures products, market conditions, and timeframes, using the Stop Hunt Indicator alongside my proprietary Signal Architect™ framework.
The goal is simple:
To show how structure, behavior, and probability repeat—every day—despite a constantly changing market.
If you follow these posts over time, you will begin to recognize that:
• The same behaviors appear across different futures contracts
• The same reactions occur on multiple timeframes
• The same structural traps and stop events repeat regardless of volatility regime
That consistency is not coincidence.
Consistency is the signal.
Over time, that consistency should become familiar—
and familiarity should become your edge.
________________________________________
🧠 What You’re Seeing (And Why It Matters)
This indicator includes a limited visual preview of a proprietary power signal I have personally developed and refined across:
• Futures
• Algorithmic trading systems
• Options structure
• Equity market behavior
Every tool I release is built around one core principle:
Clarity of direction without over-promising or over-fitting.
That is why all Signal Architect™ tools emphasize:
• Market structure first
• High-probability directional context
• Clear, visual risk framing
• No predictive claims
• No curve-fit illusions
What you see publicly is not the full system—only controlled, educational previews meant to demonstrate how structure and probability align in real markets.
________________________________________
📊 Background & Scope
Over the years, I have personally developed 800+ programs, including:
• Equity systems
• Futures strategies
• Options structure tools
• Dividend & income frameworks
• Portfolio construction and allocation logic
This includes 40+ Nasdaq-100 trading bots, several operating under extremely strict rule-sets and controlled deployment conditions.
Nothing shared publicly represents my complete internal framework.
Public posts exist for education, observation, and pattern recognition—not signals, not advice, and not promises.
________________________________________
🤝 For Those Who Find Value
If these daily posts help you see the market more clearly:
• Follow, boost, and share my scripts, Ideas, and MINDS posts
• Feel free to message me directly with questions or build requests
• Constructive feedback and collaboration are always welcome
For traders who want to go deeper, optional memberships may include:
• Additional signal access
• Early previews
• Occasional free tools and upgrades
🔗 Membership & Signals:
trianchor.gumroad.com
________________________________________
⚠️ Final Note
Everything published publicly is educational and analytical only.
Markets carry risk.
Discipline, patience, and risk management always come first.
Watch the consistency.
Study the structure.
Let the market repeat itself.
— Signal Architect™
________________________________________
🔗 Personally Developed GPT Tools
• AuctionFlow GPT
chatgpt.com
• Signal Architect™ Gamma Desk – Market Intelligence
chatgpt.com
• Gamma Squeeze Watchtower™
chatgpt.com

Signal Architect Stop-Hunt Proxy Signal Architect™ — Developer Note
These daily posts are intentional.
They are designed to help potential users visually observe consistency—not just in outcomes, but in process—across multiple futures products, market conditions, and timeframes, using the Stop Hunt Indicator alongside my proprietary Signal Architect™ framework.
The goal is simple:
To show how structure, behavior, and probability repeat—every day—despite a constantly changing market.
If you follow these posts over time, you will begin to recognize that:
• The same behaviors appear across different futures contracts
• The same reactions occur on multiple timeframes
• The same structural traps and stop events repeat regardless of volatility regime
That consistency is not coincidence.
Consistency is the signal.
Over time, that consistency should become familiar—
and familiarity should become your edge.
________________________________________
🧠 What You’re Seeing (And Why It Matters)
This indicator includes a limited visual preview of a proprietary power signal I have personally developed and refined across:
• Futures
• Algorithmic trading systems
• Options structure
• Equity market behavior
Every tool I release is built around one core principle:
Clarity of direction without over-promising or over-fitting.
That is why all Signal Architect™ tools emphasize:
• Market structure first
• High-probability directional context
• Clear, visual risk framing
• No predictive claims
• No curve-fit illusions
What you see publicly is not the full system—only controlled, educational previews meant to demonstrate how structure and probability align in real markets.
________________________________________
📊 Background & Scope
Over the years, I have personally developed 800+ programs, including:
• Equity systems
• Futures strategies
• Options structure tools
• Dividend & income frameworks
• Portfolio construction and allocation logic
This includes 40+ Nasdaq-100 trading bots, several operating under extremely strict rule-sets and controlled deployment conditions.
Nothing shared publicly represents my complete internal framework.
Public posts exist for education, observation, and pattern recognition—not signals, not advice, and not promises.
________________________________________
🤝 For Those Who Find Value
If these daily posts help you see the market more clearly:
• Follow, boost, and share my scripts, Ideas, and MINDS posts
• Feel free to message me directly with questions or build requests
• Constructive feedback and collaboration are always welcome
For traders who want to go deeper, optional memberships may include:
• Additional signal access
• Early previews
• Occasional free tools and upgrades
🔗 Membership & Signals:
trianchor.gumroad.com
________________________________________
⚠️ Final Note
Everything published publicly is educational and analytical only.
Markets carry risk.
Discipline, patience, and risk management always come first.
Watch the consistency.
Study the structure.
Let the market repeat itself.
— Signal Architect™
________________________________________
🔗 Personally Developed GPT Tools
• AuctionFlow GPT
chatgpt.com
• Signal Architect™ Gamma Desk – Market Intelligence
chatgpt.com
• Gamma Squeeze Watchtower™
chatgpt.com

Signal Architect Stop-Hunt ProxySignal Architect™ — Developer Note
These daily posts are intentional.
They are designed to help potential users visually observe consistency—not just in outcomes, but in process—across multiple futures products, market conditions, and timeframes, using the Stop Hunt Indicator alongside my proprietary Signal Architect™ framework.
The goal is simple:
To show how structure, behavior, and probability repeat—every day—despite a constantly changing market.
If you follow these posts over time, you will begin to recognize that:
The same behaviors appear across different futures contracts
The same reactions occur on multiple timeframes
The same structural traps and stop events repeat regardless of volatility regime
That consistency is not coincidence.
Consistency is the signal.
Over time, that consistency should become familiar—
and familiarity should become your edge.
🧠 What You’re Seeing (And Why It Matters)
This indicator includes a limited visual preview of a proprietary power signal I have personally developed and refined across:
Futures
Algorithmic trading systems
Options structure
Equity market behavior
Every tool I release is built around one core principle:
Clarity of direction without over-promising or over-fitting.
That is why all Signal Architect™ tools emphasize:
Market structure first
High-probability directional context
Clear, visual risk framing
No predictive claims
No curve-fit illusions
What you see publicly is not the full system—only controlled, educational previews meant to demonstrate how structure and probability align in real markets.
📊 Background & Scope
Over the years, I have personally developed 800+ programs, including:
Equity systems
Futures strategies
Options structure tools
Dividend & income frameworks
Portfolio construction and allocation logic
This includes 40+ Nasdaq-100 trading bots, several operating under extremely strict rule-sets and controlled deployment conditions.
Nothing shared publicly represents my complete internal framework.
Public posts exist for education, observation, and pattern recognition—not signals, not advice, and not promises.
🤝 For Those Who Find Value
If these daily posts help you see the market more clearly:
Follow, boost, and share my scripts, Ideas, and MINDS posts
Feel free to message me directly with questions or build requests
Constructive feedback and collaboration are always welcome
For traders who want to go deeper, optional memberships may include:
Additional signal access
Early previews
Occasional free tools and upgrades
🔗 Membership & Signals:
trianchor.gumroad.com
⚠️ Final Note
Everything published publicly is educational and analytical only.
Markets carry risk.
Discipline, patience, and risk management always come first.
Watch the consistency.
Study the structure.
Let the market repeat itself.
— Signal Architect™
🔗 Personally Developed GPT Tools
AuctionFlow GPT
chatgpt.com
Signal Architect™ Gamma Desk – Market Intelligence
chatgpt.com
Gamma Squeeze Watchtower™
chatgpt.com

eBacktesting - Learning: Liquidity GrabseBacktesting - Learning: Liquidity Grabs highlights moments when price pushes just beyond a recent swing high or swing low (where many stops tend to sit) and then quickly returns back inside the level. This behavior is often called a stop run, sweep, or liquidity grab.
Traders study these events because they can reveal:
- Where liquidity is “resting” (obvious highs/lows)
- A quick sweep and rejection (often a wick)
- When a breakout attempt is actually a trap
- A full candle close through the level, followed by an immediate reversal back inside (classic breakout trap)
- Potential areas where price may reverse or accelerate after stops are taken
Use it as a training tool to build pattern recognition and improve your patience around key levels, especially during active sessions where sweeps happen frequently.
These indicators are built to pair perfectly with the eBacktesting extension, where traders can practice these concepts step-by-step. Backtesting concepts visually like this is one of the fastest ways to learn, build confidence, and improve trading performance.
Educational use only. Not financial advice.

EDUVEST Lorentzian ClassificationEDUVEST Lorentzian Classification - Machine Learning Signal Detection
━━━━━━━━━━━━━━━━━━━━━━━━━━━━━━━━━━━━━━━━━━━━━━━━
█ ORIGINALITY
This indicator enhances the original Lorentzian Classification concept by jdehorty with EduVest's visual modifications and alert system integration. The core innovation is using Lorentzian distance instead of Euclidean distance for k-NN classification, providing more robust pattern recognition in financial markets.
━━━━━━━━━━━━━━━━━━━━━━━━━━━━━━━━━━━━━━━━━━━━━━━━
█ WHAT IT DOES
- Generates BUY/SELL signals using machine learning classification
- Displays kernel regression estimate for trend visualization
- Shows prediction values on each bar
- Provides trade statistics (Win Rate, W/L Ratio)
- Includes multiple filter options (Volatility, Regime, ADX, EMA, SMA)
━━━━━━━━━━━━━━━━━━━━━━━━━━━━━━━━━━━━━━━━━━━━━━━━
█ HOW IT WORKS
【Lorentzian Distance Calculation】
Unlike Euclidean distance, Lorentzian distance uses logarithmic transformation:
d = Σ log(1 + |xi - yi|)
This provides:
- Better handling of outliers
- More stable distance measurements
- Reduced sensitivity to extreme values
【Feature Engineering】
The classifier uses up to 5 configurable features:
- RSI (Relative Strength Index)
- WT (WaveTrend)
- CCI (Commodity Channel Index)
- ADX (Average Directional Index)
Each feature is normalized using the n_rsi, n_wt, n_cci, or n_adx functions.
【k-Nearest Neighbors Classification】
1. Calculate Lorentzian distance between current bar and historical bars
2. Find k nearest neighbors (default: 8)
3. Sum predictions from neighbors
4. Generate signal based on prediction sum (>0 = Long, <0 = Short)
【Kernel Regression】
Uses Rational Quadratic kernel for smooth trend estimation:
- Lookback Window: 8
- Relative Weighting: 8
- Regression Level: 25
【Filters】
- Volatility Filter: Filters signals during extreme volatility
- Regime Filter: Identifies market regime using threshold
- ADX Filter: Confirms trend strength
- EMA/SMA Filter: Trend direction confirmation
━━━━━━━━━━━━━━━━━━━━━━━━━━━━━━━━━━━━━━━━━━━━━━━━
█ HOW TO USE
【Recommended Settings】
- Timeframe: 15M, 1H, 4H, Daily
- Neighbors Count: 8 (default)
- Feature Count: 5 for comprehensive analysis
【Signal Interpretation】
- Green BUY label: Long entry signal
- Red SELL label: Short entry signal
- Bar colors: Green (bullish) / Red (bearish) prediction strength
【Trade Statistics Panel】
- Winrate: Historical win percentage
- Trades: Total (Wins|Losses)
- WL Ratio: Win/Loss ratio
- Early Signal Flips: Premature signal changes
【Filter Recommendations】
- Enable Volatility Filter for ranging markets
- Enable Regime Filter for trend confirmation
- Use EMA Filter (200) for higher timeframes
━━━━━━━━━━━━━━━━━━━━━━━━━━━━━━━━━━━━━━━━━━━━━━━━
█ CREDITS
Original Lorentzian Classification concept and MLExtensions library by jdehorty.
Enhanced with visual modifications and alert integration by EduVest.
License: Mozilla Public License 2.0

Liquidation Map [Alpha Extract]A sophisticated liquidity distribution visualization system that identifies potential liquidation zones through pivot-based detection and renders them as an interactive histogram with cumulative distance-to-liquidation curves. Utilizing multi-exchange volume aggregation and ATR-scaled pocket detection, this indicator delivers institutional-grade liquidity mapping with real-time histogram display showing relative concentration of long and short liquidation levels across configurable price ranges. The system's box-based rendering architecture combined with cumulative distribution overlays provides comprehensive visual assessment of asymmetric liquidity positioning for strategic trade planning.
🔶 Advanced Multi-Exchange Aggregation Framework
Implements intelligent ticker detection and multi-source volume aggregation across major exchanges including Binance, Bybit, KuCoin, OKX, and MEXC for accurate liquidity weight calculations. The system automatically identifies base currency (BTC, ETH, SOL) from chart ticker, retrieves volume data from matching perpetual contracts across multiple venues, and aggregates into composite volume metric for enhanced pocket weighting accuracy.
🔶 Pivot-Based Liquidation Pocket Detection
Features sophisticated swing point identification using configurable pivot width with ATR-scaled vertical zone construction for volatility-adaptive pocket sizing. The system detects pivot highs for short liquidation zones (placed above swing) and pivot lows for long liquidation zones (placed below swing), applying 200-period ATR with percentage multipliers to determine pocket heights that adjust to market volatility conditions.
🔶 Interactive Histogram Visualization Engine
Provides real-time box-based histogram rendering in indicator pane with configurable bin counts (up to 400 columns) and adjustable height, displaying liquidity concentration across fixed percentage range above and below current price. The system calculates bin sizes from view range, accumulates pocket weights into price bins, and renders vertical bars with gradient color intensity reflecting relative liquidity concentration at each price level.
🔶 Cumulative Distance Overlay System
Implements innovative cumulative distribution curves showing aggregate liquidity distance from current price for both long (left) and short (right) positions. The system calculates running totals of pocket weights from current price outward in both directions, normalizes against maximum span, and overlays line segments showing how much total liquidity exists at various distances, enabling instant assessment of liquidation cascade potential.
🔶 Dynamic Price Range Adaptation
Features fixed percentage-based view window that maintains consistent price range visualization across all timeframes and instruments, automatically centering histogram on current price with configurable +/- percentage bounds. The system recalculates histogram bins and pocket distributions on each bar close, ensuring visualization adapts to price movement while maintaining interpretable scale regardless of volatility regime.
🔶 Touch Detection and Weight Adjustment
Provides intelligent pocket state tracking that identifies when price trades through liquidation zones and applies configurable weight multipliers to touched pockets for historical context. The system monitors price interaction with pocket midpoints, marks pockets as "hit" when violated, and optionally increases their visual weight (default 5x) to emphasize historical liquidation levels while distinguishing from untouched future zones.
🔶 Gradient Intensity Color System
Implements sophisticated color gradient engine that modulates bar opacity from transparent to opaque based on relative liquidity concentration within each bin. The system normalizes bin values against maximum liquidity, applies color interpolation from faded to vivid hues, and distinguishes long liquidation zones (cyan) from short liquidation zones (yellow/gold) with current price column highlighted in red for instant orientation.
🔶 Performance-Optimized Rendering Architecture
Utilizes efficient box and line object management with dynamic allocation based on histogram configuration, implementing intelligent cleanup and reuse to maintain smooth performance. The system includes adaptive line budget calculations that adjust segment density for cumulative curves based on available object limits, ensuring consistent operation even with maximum histogram resolution settings.
🔶 Asymmetric Distribution Analysis
Calculates separate cumulative distributions for long and short liquidation zones split at current price, enabling identification of imbalanced liquidity positioning. The system normalizes distributions against respective maximums and overlays both curves on single histogram, allowing traders to instantly assess whether more liquidation risk exists above (shorts vulnerable) or below (longs vulnerable) current price levels.
🔶 Configurable Label and Scale System
Provides price axis labeling with adjustable frequency to reduce clutter while maintaining reference points, displaying price values at regular column intervals with configurable offset positioning. The system includes current price label showing exact value and percentile position within view range, offering both absolute price reference and relative positioning context for distribution interpretation.
🔶 Historical Pocket Persistence Framework
Maintains rolling window of liquidation pockets up to 3000 bars with automatic expiration management and optional preservation of touched zones for historical analysis. The system tracks pocket creation time, monitors age against lookback limits, and manages array cleanup to prevent memory overflow while retaining relevant historical liquidation levels for pattern recognition and support/resistance validation.
This indicator delivers sophisticated liquidity distribution analysis through histogram visualization and cumulative distance curves that reveal asymmetric positioning of potential liquidation levels. Unlike simple liquidation heatmaps that show absolute levels, the Liquidation Map's cumulative distribution overlays instantly communicate how much total liquidity exists at various distances from current price, enabling assessment of cascade potential. The system's multi-exchange volume aggregation, touch-weighted historical zones, and fixed-range visualization make it essential for traders seeking strategic positioning around institutional liquidity clusters in cryptocurrency futures markets. The histogram format enables instant identification of price levels where concentrated liquidations may trigger significant volatility or reversal events, while the asymmetric distribution curves reveal whether market structure favors upside or downside cascades.

Jake's Candle by Candle UpgradedJake's Candle by Candle Upgraded
The "Story of the Market" Automated
This is not just another signal indicator. Jake's Candle by Candle Upgraded is a complete institutional trading framework designed for high-precision scalping on the 1-minute and 5-minute timeframes.
Built strictly on the principles of Al Brooks Price Action and Smart Money Concepts (SMC), this tool automates the rigorous "Candle-by-Candle" analysis used by professional floor traders. It moves beyond simple pattern recognition to read the "Story" of the market—Context, Setup, and Pressure—before ever allowing a trade.
The Philosophy: Why This Tool Was Built
Most retail traders fail for two reasons:
Getting Trapped: They enter on the first sign of a reversal (H1/L1), which is often an institutional trap.
Trading Chop: They bleed capital during low-volume, sideways markets.
This tool solves both problems with an Algorithmic Discipline Engine. It does not guess. It waits for the specific "Second Leg" criteria used by institutions and physically disables itself during dangerous market conditions.
Key Features
1. The Context Dashboard (HUD)
A professional Heads-Up Display in the top-right corner keeps you focused on the macro picture while you scalp.
FLOW: Monitors the 20-period Institutional EMA. (Green = Bull Flow, Red = Bear Flow). You are prevented from trading against the dominant trend.
STATE: A built-in "Volatility Compressor." If it says "⚠️ CHOP / RANGE", the algorithm is disabled. It protects you from overtrading during lunch hours or low-volume zones.
SETUP: Live tracking of the Al Brooks leg count. It tells you exactly when the algorithm is "Waiting for Pullback" or "Searching for Entry."
2. Smart "Trap Avoidance" Logic (H2/L2)
This tool uses the "Gold Standard" of scalping setups: The High 2 (H2) and Low 2 (L2).
It ignores the first breakout attempt (Leg 1), acknowledging it as a potential trap.
It waits for the pullback and only signals on the Second Leg, statistically increasing the probability of a successful trend resumption.
3. Volatility-Adaptive Risk Management
Stop calculating pips in your head. The moment a signal is valid, the tool draws your business plan on the chart:
Stop Loss (Red Line): Automatically placed behind the "Signal Bar" (the candle that created the setup) based on strict price action rules.
Take Profit (Green Line): Automatically projected at a 1.5 Risk-to-Reward Ratio.
Smart Adaptation: The targets expand and contract based on real-time market volatility. If the market is quiet, targets are tighter. If explosive, targets are wider.
4. The "Snap Entry" Signal
The BUY and SELL badges are not lagging. They are programmed with "Stop Entry" logic—appearing the exact moment price breaks the structure of the Signal Bar, ensuring you enter on momentum, not hope.
How to Trade Strategy
Check the HUD: Ensure FLOW matches your direction and STATE says "✅ VOLATILE".
Wait for the Badge: Do not front-run the tool. Wait for the BUY or SELL badge to print.
Set Your Orders: Once the signal candle closes:
Place your Stop Loss at the Red Line.
Place your Take Profit at the Green Line.
Walk Away: The trade is now a probability event. Let the math play out.
Technical Specifications
Engine: Pine Script v6 (Strict Compliance).
Best Timeframes: 1m, 5m.
Best Assets: Indices (NQ, ES), Gold (XAUUSD), and high-volume Crypto (BTC, ETH).

Goldilocks Pivot FractalsGOLDILOCKS PIVOT FRACTALS - DESCRIPTION
Overview
Goldilocks Pivot Fractals identifies swing highs and lows using fractal pattern recognition with professional visual presentation. This indicator marks potential reversal points where price creates distinct peaks and valleys - perfect pivot points for support, resistance, and market structure analysis.
The "Goldilocks" name reflects the perfectly balanced visual presentation: not too cluttered, not too plain, just right for professional traders. Unlike standard fractal indicators, this edition features fully customizable Buy/Sell labels with tick-based positioning, independent toggle controls, and a high-contrast color scheme optimized for both dark and light chart themes.
What Makes It Unique:
- Professional label system with full customization (colors, sizes, tick-based offsets)
- Toggle labels and arrow shapes independently
- High-contrast default colors (teal/maroon) optimized for maximum visibility
- Clean, trader-friendly interface with intuitive settings
- Works flawlessly on all timeframes and instruments
How to Use
PERIOD ADJUSTMENT & ADJUSTING SENSITIVITY
The Period(s) setting controls how many signals you see:
• Period = 2 (default): Shows more signals, catches smaller price swings - best for day trading and scalping
• Period = 3-4: Shows medium amount of signals, filters out tiny moves - good for swing trading (holding days to weeks)
• Period = 5 or higher: Shows fewer signals, only the biggest turning points - best for long-term position trading
- Simple rule: Lower number = more signals. Higher number = fewer, but stronger signals.
SIGNALS
🟢 "BUY Label" (Down Fractal)
- Marks swing lows and potential support zones
- Look for price bouncing up after the fractal forms
- Use for identifying pullback entry points in uptrends
- Place stops below recent BUY fractals
🔴 "SELL Label" (Up Fractal)
- Marks swing highs and potential resistance zones
- Look for price rejecting down after the fractal forms
- Use for identifying profit targets or short entries
- Place stops above recent SELL fractals
REPAINTING BEHAVIOR
⚠️ This indicator repaints by design. Fractals require N bars on both sides to confirm, so they appear N bars after the actual pivot point. This is normal and ensures accurate pivot identification. Wait for complete confirmation before trading.
TRADING APPLICATIONS
1. Support/Resistance: Mark key price levels for entries and exits
2. Market Structure: higher BUY fractals = uptrend, lower SELL fractals = downtrend
3. Stop Placement: Use recent fractals as logical stop-loss levels
4. Breakout Trading: Monitor price breaking above/below fractal levels
5. Trend Following: Enter on pullbacks to BUY fractals in uptrends
6. Swing Trading: Identify major swing points for position entries
CUSTOMIZATION OPTIONS
• Show BUY/SELL Labels**: Toggle professional text labels on/off
• Show Shapes: Toggle arrow shapes independently
• Offset (ticks): Adjust label distance from price bars for perfect positioning
• Colors: Customize backgrounds (default: teal/maroon) and text (default: white/yellow)
• Label Size: Choose from tiny, small, normal, large, or huge
The high-contrast default colors provide excellent visibility without adjustment, but full customization is available to match any chart theme.
Key Settings
Periods (n) (default: 2): Number of bars on each side of pivot. Lower = more signals, Higher = fewer, stronger signals
Show BUY/SELL Labels (default: ON): Display professional text labels
Show Shapes (default: ON): Display arrow shapes
BUY offset (ticks) (default: 8): Distance BUY labels appear below lows
SELL offset (ticks) (default: 8): Distance SELL labels appear above highs
Colors: Full customization - defaults optimized for visibility
Label size (default: normal): Visual prominence control
Key Features
✅ Professional pivot fractal detection
✅ Fully customizable Buy/Sell labels
✅ Independent toggle for labels and shapes
✅ Tick-based offset positioning
✅ High-contrast color scheme
✅ Works on all timeframes and instruments
✅ Clean, intuitive interface
✅ Adjustable sensitivity
✅ Perfect for support/resistance identification
✅ Ideal for market structure analysis

Alpha Options System# Apex Options Sniper - Advanced Multi-Signal Day Trading System
## 🎯 Overview
**Apex Options Sniper** is a professional-grade, multi-signal trading indicator specifically engineered for high-probability day trading of weekly options. This comprehensive system combines 10+ technical indicators into a sophisticated scoring algorithm that identifies optimal entry points with institutional-level precision.
Perfect for traders of SPY, QQQ, and high-volume stocks, this indicator eliminates guesswork by providing clear BUY CALLS and BUY PUTS signals based on multiple technical confluences.
---
## 🚀 Key Features
### **Multi-Signal Confluence Engine**
- **10+ Technical Indicators** working in harmony
- **Weighted Scoring System** (0-30+ points) for signal strength
- **Real-time Signal Classification**: Strong vs Moderate signals
- **False Signal Reduction** through multi-confirmation requirements
### **Advanced Momentum Analysis**
- ✅ RSI with Divergence Detection (bullish & bearish)
- ✅ Stochastic Oscillator (oversold/overbought + crossovers)
- ✅ MACD with crossover and momentum confirmation
- ✅ Automatic divergence spotting for reversal trades
### **Sophisticated Trend Detection**
- ✅ Triple EMA System (9/21/50) with alignment scoring
- ✅ SuperTrend Indicator with trend flip alerts
- ✅ VWAP for institutional price levels
- ✅ Multi-timeframe trend confirmation
### **Professional Volume Analysis**
- ✅ Volume Spike Detection (vs 20-period average)
- ✅ OBV (On-Balance Volume) with divergence detection
- ✅ Order Flow Analysis (buy vs sell pressure)
- ✅ Relative volume ratio display
### **Advanced Pattern Recognition**
- ✅ Bollinger Band Squeeze detection (volatility expansion)
- ✅ BB breakout signals (major move initiation)
- ✅ Automatic Support & Resistance levels (pivot-based)
- ✅ Price reaction scoring at key levels
### **Built-in Risk Management**
- ✅ ATR-based Stop Loss calculations
- ✅ Customizable Risk:Reward ratios
- ✅ Position sizing recommendations
- ✅ Real-time profit target calculations
### **Comprehensive Visual Dashboard**
- ✅ Live scoring breakdown for all indicators
- ✅ Individual signal strength display
- ✅ Bull vs Bear score comparison
- ✅ Color-coded signal status
- ✅ Risk management metrics
---
## 📊 How It Works
### **Scoring System**
The indicator assigns points based on technical conditions:
| **Category** | **Max Points** | **Conditions** |
|-------------|---------------|----------------|
| Momentum (RSI/Stoch) | 8 | Oversold/overbought + divergences |
| MACD | 4 | Crossovers + momentum direction |
| Trend (EMAs) | 6 | EMA alignment + SuperTrend |
| Volume | 4 | Spikes + OBV divergences |
| Order Flow | 2 | Buy/sell pressure imbalance |
| Bollinger Bands | 2 | Squeeze + breakouts |
| Support/Resistance | 2 | Price at key levels |
| VWAP | 1 | Above/below institutional level |
### **Signal Thresholds**
- **🚀 STRONG CALLS**: Bull score ≥6, Net score ≥4
- **📈 CALLS**: Bull score ≥4, Net score ≥2
- **🔥 STRONG PUTS**: Bear score ≥6, Net score ≤-4
- **📉 PUTS**: Bear score ≥4, Net score ≤-2
### **Multi-Timeframe Filter**
Optional higher timeframe confirmation reduces false signals by ensuring the broader trend supports your trade direction.
---
## 🎮 How to Use
### **Installation**
1. Open TradingView Pine Editor
2. Paste the complete indicator code
3. Click "Add to Chart"
4. Customize settings to your preference
### **Recommended Settings**
**For SPY/QQQ Day Trading:**
- Timeframe: 1-minute or 5-minute
- Strong Signal Threshold: 6
- Moderate Signal Threshold: 4
- Multi-timeframe Confluence: ON
**For Individual Stocks:**
- Timeframe: 5-minute or 15-minute
- Increase SuperTrend multiplier to 3.5-4.0
- Enable all advanced features
**For Scalping:**
- Timeframe: 1-minute
- Use STRONG signals only (6+)
- Tight stop loss (1.0-1.5 ATR multiplier)
### **Best Trading Times**
- **9:30-11:00 AM EST** - Highest volume, strongest signals
- **2:00-4:00 PM EST** - Afternoon momentum plays
- Avoid 11:30 AM-1:30 PM EST (lunch chop)
---
## 📈 Signal Interpretation
### **What You'll See on Chart:**
**Visual Signals:**
- 🟢 **Green Triangle (CALLS)**: Bullish entry point
- 🟢 **Large Green Triangle (STRONG CALLS)**: High-confidence bullish entry
- 🔴 **Red Triangle (PUTS)**: Bearish entry point
- 🔴 **Large Red Triangle (STRONG PUTS)**: High-confidence bearish entry
- 💎 **Small Diamonds**: RSI/OBV divergences (reversal warning)
**Dashboard Information:**
- Individual indicator values and signals
- Real-time score breakdown
- Bull/Bear score totals
- ATR stop loss levels
### **Entry Rules:**
✅ **High Probability Trades (Take These):**
- Strong signal (6+ score)
- 3+ indicators confirming
- Volume spike present
- SuperTrend aligned
- Higher timeframe confirms
⚠️ **Moderate Trades (Smaller Position):**
- Moderate signal (4-5 score)
- 2+ indicators confirming
- Normal volume
- Mixed trend signals
❌ **Avoid These:**
- Conflicting signals (Bull score ≈ Bear score)
- Low volume
- During major news events
- Bollinger squeeze without breakout direction
---
## 🛡️ Risk Management Guide
### **Position Sizing:**
- **Strong Signals (6+)**: 3-5% of portfolio
- **Moderate Signals (4-5)**: 2-3% of portfolio
- **Low Conviction**: 1-2% or skip
### **Stop Loss Strategy:**
- Use ATR-based stops (displayed in dashboard)
- Default: 1.5x ATR from entry
- Weekly options: 30-50% premium loss maximum
- Never hold through stop loss hoping for recovery
### **Profit Targets:**
- **Quick Scalps**: 25-50% gain (15-30 min)
- **Day Trades**: 50-100% gain (same day exit)
- **Swing**: 100-200% gain (1-2 days max for weeklies)
- **Take partial profits** at first target, let rest run
### **Time Decay Management (Weekly Options):**
- Monday-Wednesday: Hold overnight acceptable on strong signals
- Thursday: Close by EOD unless very strong conviction
- Friday: Avoid holding overnight, theta decay accelerates
---
## 🔔 Alert Configuration
### **Recommended Alerts:**
**Essential Alerts:**
1. 🚀 Strong Buy Calls
2. 🔥 Strong Buy Puts
**Advanced Alerts:**
3. 💎 RSI Bullish Divergence
4. ⚠️ RSI Bearish Divergence
5. 🔶 Bollinger Band Squeeze
6. ✅ SuperTrend Bull Flip
7. ❌ SuperTrend Bear Flip
**Alert Setup:**
- Set frequency: "Once Per Bar Close"
- Enable for all devices
- Use webhook for automation (optional)
---
## 💡 Pro Trading Tips
### **Maximize Win Rate:**
1. **Wait for confluence** - Best trades have 3+ indicators aligned
2. **Respect the dashboard** - Check WHY it's signaling (which indicators)
3. **Volume is king** - Signals with volume spikes are significantly more reliable
4. **Use BB Squeeze** - When squeeze + signal = explosive directional move
5. **SuperTrend flips** - Major trend change confirmations, very powerful
6. **Watch for divergences** - Diamond markers = hidden reversal opportunities
### **Common Mistakes to Avoid:**
❌ Trading every signal (be selective)
❌ Ignoring volume (volume confirms everything)
❌ Fighting the higher timeframe trend
❌ Oversizing positions on moderate signals
❌ Holding weekly options too long (theta decay)
❌ Trading during lunch hour (11:30-1:30 EST)
### **Advanced Techniques:**
- **Divergence + Support/Resistance** = Highest probability reversals
- **BB Squeeze + EMA alignment** = Explosive trend continuations
- **SuperTrend flip + Volume spike** = Major trend change entries
- **Multiple timeframe analysis** - Check 5m signal on 1m chart for precision entries
---
## 📊 Indicator Components Explained
### **RSI (Relative Strength Index)**
- Measures momentum and overbought/oversold conditions
- Divergences signal potential reversals before they happen
- Score: 2-3 points for extremes and divergences
### **Stochastic Oscillator**
- Confirms momentum extremes
- Crossovers provide entry timing
- Score: 1-2 points
### **MACD (Moving Average Convergence Divergence)**
- Trend following momentum indicator
- Crossovers signal momentum shifts
- Score: 1-3 points based on signal strength
### **EMA System (9/21/50)**
- Dynamic support and resistance
- Alignment shows trend strength
- Price position relative to EMAs scores 1-2 points
### **SuperTrend**
- Volatility-based trend indicator
- Reduces whipsaws in choppy conditions
- Trend flips are major signals (2 points)
### **Bollinger Bands**
- Volatility measurement
- Squeeze = calm before the storm
- Breakouts = directional move initiation (2 points)
### **Volume Analysis**
- Confirms price movement legitimacy
- Spikes validate signals (2 points)
- OBV divergences predict reversals (2 points)
### **Order Flow**
- Buy vs sell pressure measurement
- Institutional footprint detection
- Score: 2 points for strong imbalances
---
## 🎓 Learning Path
### **Beginner (Week 1-2):**
- Use STRONG signals only
- Focus on high-volume stocks (SPY/QQQ)
- Trade only first hour of market
- Use paper trading first
### **Intermediate (Week 3-4):**
- Add moderate signals to your arsenal
- Learn to read the dashboard
- Understand why each signal triggers
- Start combining with support/resistance
### **Advanced (Month 2+):**
- Use divergence signals
- Trade BB squeeze breakouts
- Optimize settings for your style
- Develop your own confluence rules
---
## ⚙️ Customization Guide
### **Adjustable Parameters:**
**Momentum Settings:**
- RSI Length (default: 14)
- RSI Oversold/Overbought levels (30/70)
- Stochastic Length (14)
**Trend Settings:**
- EMA periods (9/21/50)
- SuperTrend ATR Length (10)
- SuperTrend Multiplier (3.0)
**Volume Settings:**
- Volume MA Length (20)
- Volume Spike Threshold (1.5x)
**Advanced Settings:**
- Bollinger Band Length (20)
- BB Standard Deviation (2.0)
- Pivot Lookback (10)
**Signal Thresholds:**
- Strong Signal Score (default: 6)
- Moderate Signal Score (default: 4)
**Risk Management:**
- ATR Length (14)
- Stop Loss Multiplier (1.5)
- Risk:Reward Ratio (2.0)
---
## 📈 Performance Optimization
### **For Volatile Markets (VIX > 25):**
- Increase SuperTrend multiplier to 4.0
- Raise signal thresholds (+1 point)
- Tighten stop losses (1.0-1.2 ATR)
### **For Ranging Markets:**
- Focus on RSI extremes and divergences
- Use BB squeeze signals
- Ignore moderate signals
- Wait for support/resistance confirmation
### **For Trending Markets:**
- Follow SuperTrend direction religiously
- Use EMA alignment signals
- Allow wider stops (2.0 ATR)
- Take partial profits, let winners run
---
## 🔍 Troubleshooting
**Too Many Signals:**
- Increase signal thresholds to 7/5
- Enable multi-timeframe filter
- Trade only STRONG signals
**Missing Signals:**
- Decrease thresholds to 5/3
- Disable multi-timeframe filter
- Check that all features are enabled
**Whipsaw in Choppy Markets:**
- Increase SuperTrend multiplier
- Require volume spike confirmation
- Avoid trading 11:30 AM-1:30 PM EST
---
## 🏆 Best Practices
✅ **Always check:**
1. Dashboard shows why signal triggered
2. Volume confirms the move
3. Not during news events
4. Adequate time until expiration
✅ **Risk Management:**
1. Never risk more than 2% per trade
2. Use stops religiously
3. Take profits at targets
4. Don't revenge trade
✅ **Journal Your Trades:**
1. Entry price and signal strength
2. Which indicators triggered
3. Exit price and profit/loss
4. What worked and what didn't
---
## 📞 Support & Updates
This indicator is designed to evolve with market conditions. Recommended to:
- Review settings monthly
- Backtest on your favorite instruments
- Adjust thresholds based on your risk tolerance
- Keep a trading journal to track performance
---
## ⚠️ Disclaimer
This indicator is a tool for technical analysis and should not be used as the sole basis for trading decisions. Options trading involves substantial risk and is not suitable for all investors. Past performance does not guarantee future results. Always:
- Do your own research and due diligence
- Never invest more than you can afford to lose
- Consider consulting with a financial advisor
- Practice with paper trading before using real money
- Understand options Greeks (Delta, Theta, Gamma, Vega)
- Be aware of earnings dates and major news events
**No indicator is 100% accurate. Use proper risk management and trade responsibly.**
---
## 📊 Version History
**v1.0 - Initial Release**
- Multi-signal confluence system
- 10+ technical indicators
- Advanced dashboard
- ATR-based risk management
- Comprehensive alert system
---
## 🎯 Final Thoughts
**Apex Options Sniper** transforms complex technical analysis into clear, actionable signals. By combining multiple proven indicators with sophisticated scoring logic, it helps traders identify high-probability setups while managing risk effectively.
**Success Keys:**
- Quality over quantity (be selective)
- Risk management is everything
- Volume confirms the signal
- Confluence increases probability
- Discipline beats emotion
**Trade smart. Trade with confidence. Trade with Apex Options Sniper.**
---
*For questions, suggestions, or to share your success stories, please comment below or send a message.*
**Happy Trading! 🚀📈**

SMC + OB + FVG + Reversal + UT Bot + Hull Suite – by Fatich.id🎯 7 INTEGRATED SYSTEMS:
✓ Mxwll Suite (SMC + Auto Fibs + CHoCH/BOS)
✓ UT Bot (Trend Signals + Label Management)
✓ Hull Suite (Momentum Analysis)
✓ LuxAlgo FVG (Fair Value Gaps)
✓ LuxAlgo Order Blocks (Volume Pivots) ⭐ NEW
✓ Three Bar Reversal (Pattern Recognition)
✓ Reversal Signals (Momentum Count Style)
⚡ KEY FEATURES:
• Smart Money Structure (CHoCH/BOS/I-CHoCH/I-BoS)
• Auto Fibonacci (10 customizable levels)
• Order Block Detection (Auto mitigation)
• Fair Value Gap Tracking
• Session Highlights (NY/London/Asia)
• Volume Activity Dashboard
• Multi-Timeframe Support
• Clean Label Management
🎨 PERFECT FOR:
• Smart Money Concept Traders
• Order Flow & Liquidity Analysis
• Support/Resistance Trading
• Trend Following & Reversals
• Multi-Timeframe Analysis
💡 RECOMMENDED SETTINGS:
Clean Charts: OB Count 3, UT Signals 3, FVG 5
Detailed Analysis: OB Count 5-10, All Signals
Scalping: Low sensitivity, Hull 20-30
Swing Trading: High sensitivity, Hull 55-100

Swing High-Low Line ConnectorSwing High-Low Line Connector is a simple and intuitive tool that automatically detects swing highs and swing lows using fractal-style pivot logic and connects them with clean, continuous lines. This indicator helps traders visualize market structure, trend shifts, and swing-based support/resistance levels at a glance.
The script identifies each confirmed swing point based on a user-defined lookback window (left/right bars). When a new swing is confirmed, the indicator updates the previous leg or creates a new one, effectively drawing the classic “zigzag-style” connections used in discretionary trading and price-action analysis.
A dynamic tail extension is included to show the most recent swing extending toward the current price. By default, the tail follows a ZigZag-style logic—extending upward after a swing low and downward after a swing high—but users can also anchor it to Close, High, Low, or HL2.
Features
Automatic detection of swing highs and swing lows
Clean line connections between swings (similar to discretionary market-structure mapping)
Proper consolidation handling: weaker highs/lows are ignored
Optional ZigZag-style dynamic tail extension
Fully customizable lookback window, line color, and line width
Works on any market and timeframe
Use Cases
Identifying market structure (HH, HL, LH, LL)
Visualizing trend transitions
Spotting breakout levels and swing-based support/resistance
Aiding discretionary swing trading, trend following, or pattern recognition
This indicator keeps the logic simple and visual—ideal for traders who prefer clean chart structure without unnecessary noise.

Smart Money Dynamics Blocks - Pearson MatrixSmart Money Dynamics Blocks — Pearson Matrix
A structural fusion of Prime Number Theory, Pearson Correlation, and Cumulative Delta Geometry.
1. Mathematical Foundation
This indicator is built on the intersection of Prime Number Theory and the Pearson correlation coefficient, creating a structural framework that quantifies how price and time evolve together.
Prime numbers — unique, indivisible, and irregular — are used here as nonlinear time intervals. Each prime length (2, 3, 5, 7, 11…97) represents a regression horizon where correlation is measured between price and time. The result is a multi-scale correlation lattice — a geometric matrix that captures hidden directional strength and temporal bias beyond traditional moving averages.
2. The Pearson Matrix Logic
For every prime interval p, the indicator calculates the linear correlation:
r_p = corr(price, bar_index, p)
Each r_p reflects how closely price and time move together across a prime-defined window. All r_p values are then averaged to create avgR, a single adaptive coefficient summarizing overall structural coherence.
- When avgR > 0.8 → strong positive correlation (labeled R+).
- When avgR < -0.8 → strong negative correlation (labeled R−).
This approach gives a mathematically grounded definition of trend — one that isn’t based on pattern recognition, but on measurable correlation strength.
3. Sequential Prime Slope and Median Pivot
Using the ordered sequence of 25 prime intervals, the model computes sequential slopes between adjacent primes. These slopes represent the rate of change of structure between two prime scales. A robust median aggregator smooths the slopes, producing a clean, stable directional vector.
The system anchors this slope to the 41-bar pivot — the median of the first 25 primes — serving as the geometric midpoint of the prime lattice. The resulting yellow line on the chart is not an ordinary regression line; it’s a dynamic prime-slope function, adapting continuously with correlation feedback.
4. Regression-Style Parallel Bands
Around this prime-slope line, the indicator constructs parallel bands using standard deviation envelopes — conceptually similar to a regression channel but recalculated through the prime–Pearson matrix.
These bands adjust dynamically to:
- Volatility, via standard deviation of residuals.
- Correlation strength, via avgR sign weighting.
Together, they visualize statistical deviation geometry, making it easier to observe symmetry, expansion, and contraction phases of price structure.
5. Volume and Cumulative Delta Peaks
Below the geometric layer, the indicator incorporates a custom lower-timeframe volume feed — by default using 15-second data (custom_tf_input_volume = “15S”). This allows precise delta computation between up-volume and down-volume even on higher timeframe charts.
From this feed, the indicator accumulates delta over a configurable period (default: 100 bars). When cumulative delta reaches a local maximum or minimum, peak and trough markers appear, showing the precise bar where buying or selling pressure statistically peaked.
This combination of geometry and order flow reveals the intersection of market structure and energy — where liquidity pressure expresses itself through mathematical form.
6. Chart Interpretation
The primary chart view represents the live execution of the indicator. It displays the relationship between structural correlation and volume behavior in real time.
Orange “R+” and blue “R−” labels indicate regions of strong positive or negative Pearson correlation across the prime matrix. The yellow median prime-slope line serves as the structural backbone of the indicator, while green and red parallel bands act as dynamic regression boundaries derived from the underlying correlation strength. Peaks and troughs in cumulative delta — displayed as numerical annotations — mark statistically significant shifts in buying and selling pressure.
The secondary visualization (Prime Regression Concept) expands on this by illustrating how regression behavior evolves across prime intervals. Each colored regression fan corresponds to a prime number window (2, 3, 5, 7, …, 97), demonstrating how multiple regression lines would appear if drawn independently. The indicator integrates these into one unified geometric model — eliminating the need to plot tens of regression lines manually. It’s a conceptual tool to help visualize the internal logic: the synthesis of many small-scale regressions into a single coherent structure.
7. Interpretive Insight
This model is not a prediction tool; it’s an instrument of mathematical observation. By translating price dynamics into a prime-structured correlation space, it reveals how coherence unfolds through time — not as a forecast, but as a measurable evolution of structure.
It unifies three analytical domains:
- Prime distribution — defines a nonlinear temporal architecture.
- Pearson correlation — quantifies statistical cohesion.
- Cumulative delta — expresses behavioral imbalance in order flow.
The synthesis creates a geometric analysis of liquidity and time — where structure meets energy, and where the invisible rhythm of market flow becomes measurable.
8. Contribution & Feedback
Share your observations in the comments:
- The time gap and alternation between R+ and R− clusters.
- How different timeframes change delta sensitivity or reveal compression/expansion.
- Prime intervals/clusters that tend to sit near turning points or liquidity shifts.
- How avgR behaves across assets or regimes (trending, ranging, high-vol).
- Notable interactions with the parallel bands (touches, breaks, mean-revert).
Your field notes help others read the model more effectively and compare contexts.
Summary
- Primes define the structure.
- Pearson quantifies coherence.
- Slope median stabilizes geometry.
- Regression bands visualize deviation.
- Cumulative delta locates imbalance.
Together, they construct a framework where mathematics meets market behavior.

HammerThis indicator automatically detects powerful candlestick formations such as Hammer, Inverted Hammer, Bullish Engulfing, Hanging Man, Shooting Star, and Bearish Engulfing.
It visually marks potential reversal zones on the chart and provides instant Long / Short alerts.
By combining pattern recognition with swing levels, it helps you identify possible trend reversals more clearly.
A simple, fast, and price-action-focused tool for smarter trading decisions.
💡 Yellow dotted lines indicate possible reaction zones around swing points.
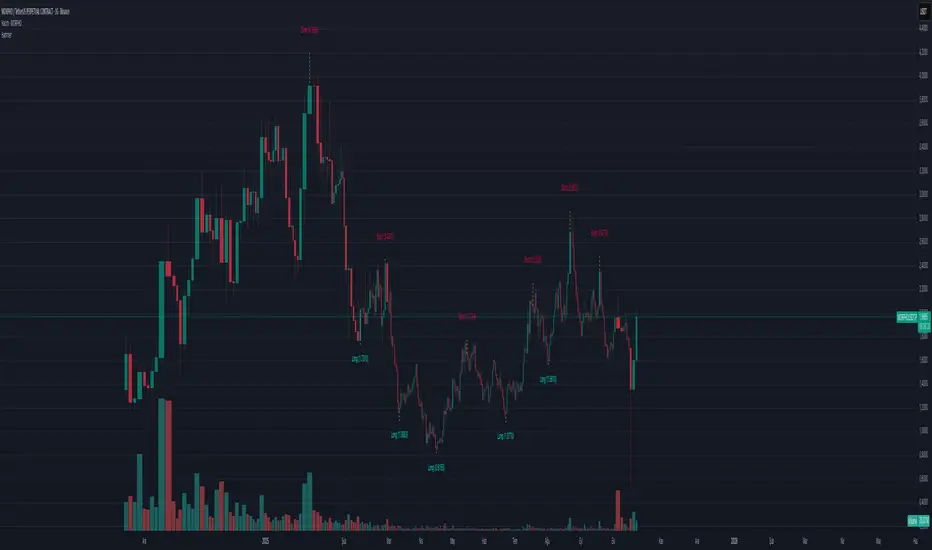
TTM Squeeze Screener [Pineify]TTM Squeeze Screener for Multiple Crypto Assets and Timeframes
This advanced TradingView Pine script, TTM Squeeze Screener, helps traders scan multiple crypto symbols and timeframes simultaneously, unlocking new dimensions in momentum and volatility analysis.
Key Features
Screen up to 8 crypto symbols across 4 different timeframes in one pane
TTM Squeeze indicator detects volatility contraction and expansion (“squeeze”) phases
Momentum filter reveals potential breakout direction and strength
Visual screener table for intuitive multi-asset monitoring
Fully customizable for symbols and timeframes
How It Works
The heart of this screener is the TTM Squeeze algorithm—a hybrid volatility and momentum indicator leveraging Bollinger Bands, Keltner Channels, and linear momentum analysis. The script checks whether Bollinger Bands are “squeezed” inside Keltner Channels, flagging periods of low volatility primed for expansion. Once a squeeze is released, the included momentum calculation suggests the likely breakout direction.
For each selected symbol and timeframe, the screener runs the TTM Squeeze logic, outputs “SQUEEZE” or “NO SQZ”, and tags momentum values. A table layout organizes the results, allowing rapid pattern recognition across symbols.
Trading Ideas and Insights
Spot multi-symbol volatility clusters—ideal for finding synchronized market moves
Assess breakout potential and direction before entering trades
Scalping and swing trading decisions are enhanced by cross-timeframe momentum filtering
Portfolio managers can quickly identify which assets are about to move
How Multiple Indicators Work Together
This screener unites three essential concepts:
Bollinger Bands : Measure volatility using standard deviation of price
Keltner Channels : Define expected price range based on average true range (ATR)
Momentum : Linear regression calculation to evaluate the direction and intensity after a squeeze
By combining these, the indicator not only signals when volatility compresses and releases, but also adds directional context—filtering false signals and helping traders time entries and exits more precisely.
Unique Aspects
Multi-symbol, multi-timeframe architecture—optimized for crypto traders and market scanners
Advanced table visualization—see all signals at a glance, minimizing cognitive overload
Modular calculation functions—easy to adapt and extend for other asset classes or strategies
Real-time, low-latency screening—built for actionable alerts on fast-moving markets
How to Use
Add the script to a TradingView chart (works on custom layouts)
Select up to 8 symbols and 4 timeframes using input fields (defaults to BTCUSD, ETHUSD, etc.)
Monitor the screener table; “SQUEEZE” highlights assets in potential breakout phase
Use momentum values to judge if the squeeze is likely bullish or bearish
Combine screener insights with manual chart analysis for optimal results
Customization
Symbols: Easily set any ticker for deep market scanning
Timeframes: Adjust to match your trading horizon (scalping, swing, long-term)
Indicator parameters: Refine Bollinger/Keltner/Momentum settings for sensitivity
Visuals: Personalize table layout, color codes, and formatting for clarity
Conclusion
In summary, the TTM Squeeze Screener is a robust, original TradingView indicator designed for crypto traders who demand a sophisticated multi-symbol, multi-timeframe edge. Its combination of volatility and momentum analytics makes it ideal for catching explosive breakouts, managing risk, and scanning the market efficiently. Whether you’re a scalper or swing trader, this screener provides the insights needed to stay ahead of the curve.

ICT Venom Trading Model [TradingFinder] SMC NY Session 2025SetupIntroduction
The ICT Venom Model is one of the most advanced strategies in the ICT framework, designed for intraday trading on major US indices such as US100, US30, and US500. This model is rooted in liquidity theory, time and price dynamics, and institutional order flow.
The Venom Model focuses on detecting Liquidity Sweeps, identifying Fair Value Gaps (FVG), and analyzing Market Structure Shifts (MSS). By combining these ICT core concepts, traders can filter false breakouts, capture sharp reversals, and align their entries with the real institutional liquidity flow during the New York Session.
Key Highlights of ICT Venom Model :
Intraday focus : Optimized for US indices (US100, US30, US500).
Time element : Critical window is 08:00–09:30 AM (Venom Box).
Liquidity sweep logic : Price grabs liquidity at 09:30 AM open.
Confirmation tools : MSS, CISD, FVG, and Order Blocks.
Dual setups : Works in both Bullish Venom and Bearish Venom conditions.
At its core, the ICT Venom Strategy is a framework that explains how institutional players manipulate liquidity pools by engineering false breakouts around the initial range of the market. Between 08:00 and 09:30 AM New York time, a range called the “Venom Box” is formed.
This range acts as a trap for retail traders, and once the 09:30 AM market open occurs, price usually sweeps either the high or the low of this box to collect stop-loss liquidity. After this liquidity grab, the market often reverses sharply, giving birth to a classic Bullish Venom Setup or Bearish Venom Setup
The Venom Model (ICT Venom Trading Strategy) is not just a pattern recognition tool but a precise institutional trading model based on time, liquidity, and market structure. By understanding the Initial Balance Range, watching for Liquidity Sweeps, and entering trades from FVG zones or Order Blocks, traders can anticipate market reversals with high accuracy. This strategy is widely respected among ICT followers because it offers both risk management discipline and clear entry/exit conditions. In short, the Venom Model transforms liquidity manipulation into actionable trading opportunities.
Bullish Setup :
Bearish Setup :
🔵 How to Use
The ICT Venom Model is applied by observing price behavior during the early hours of the New York session. The first step is to define the Initial Range, also called the Venom Box, which is formed between 08:00 and 09:30 AM EST. This range marks the high and low points where institutional traders often create traps for retail participants. Once the official market opens at 09:30 AM, price usually sweeps either the top or bottom of this box to collect liquidity.
After this liquidity grab, the market tends to reverse in alignment with the true directional bias. To confirm the setup, traders look for signals such as a Market Structure Shift (MSS), Change in State of Delivery (CISD), or the appearance of a Fair Value Gap (FVG). These elements validate the reversal and provide precise levels for trade execution.
🟣 Bullish Setup
In a Bullish Venom Setup, the market first sweeps the low of the Venom Box after 09:30 AM, triggering sell-side liquidity collection. This downward move is often sharp and deceptive, designed to stop out retail long positions and attract new sellers. Once liquidity is taken, the market typically shifts direction, forming an MSS or CISD that signals a reversal to the upside.
Traders then wait for price to retrace into a Fair Value Gap or a demand-side Order Block created during the reversal leg. This retracement offers the ideal entry point for long positions. Stop-loss placement should be just below the liquidity sweep low, while profit targets are set at the Venom Box high and, if momentum continues, at higher session or daily highs.
🟣 Bearish Setup
In a Bearish Venom Setup, the process is similar but reversed. After the Initial Range is defined, if price breaks above the Venom Box high following the 09:30 AM open, it signals a false breakout designed to collect buy-side liquidity. This move usually traps eager buyers and clears out stop-losses above the high.
After the liquidity sweep, confirmation comes through an MSS or CISD pointing to a reversal downward. At this stage, traders anticipate a retracement into a Fair Value Gap or a supply-side Order Block formed during the reversal. Short entries are taken within this zone, with stop-loss positioned just above the liquidity sweep high. The logical profit targets include the Venom Box low and, in stronger bearish momentum, deeper session or daily lows.
🔵 Settings
Refine Order Block : Enables finer adjustments to Order Block levels for more accurate price responses.
Mitigation Level OB : Allows users to set specific reaction points within an Order Block, including: Proximal: Closest level to the current price. 50% OB: Midpoint of the Order Block. Distal: Farthest level from the current price.
FVG Filter : The Judas Swing indicator includes a filter for Fair Value Gap (FVG), allowing different filtering based on FVG width: FVG Filter Type: Can be set to "Very Aggressive," "Aggressive," "Defensive," or "Very Defensive." Higher defensiveness narrows the FVG width, focusing on narrower gaps.
Mitigation Level FVG : Like the Order Block, you can set price reaction levels for FVG with options such as Proximal, 50% OB, and Distal.
CISD : The Bar Back Check option enables traders to specify the number of past candles checked for identifying the CISD Level, enhancing CISD Level accuracy on the chart.
🔵 Conclusion
The ICT Venom Model is more than just a reversal setup; it is a complete intraday trading framework that blends liquidity theory, time precision, and market structure analysis. By focusing on the Initial Range between 08:00 and 09:30 AM New York time and observing how price reacts at the 09:30 AM open, traders can identify liquidity sweeps that reveal institutional intentions.
Whether in a Bullish Venom Setup or a Bearish Venom Setup, the model allows for precise entries through Fair Value Gaps (FVGs) and Order Blocks, while maintaining clear risk management with well-defined stop-loss and target levels.
Ultimately, the ICT Venom Model provides traders with a structured way to filter false moves and align their trades with institutional order flow. Its strength lies in transforming liquidity manipulation into actionable opportunities, giving intraday traders an edge in timing, accuracy, and consistency. For those who master its logic, the Venom Model becomes not only a strategy for entry and exit, but also a deeper framework for understanding how liquidity truly drives price in the New York session.

Oscillator Matrix [Alpha Extract]A comprehensive multi-oscillator system that combines volume-weighted money flow analysis with enhanced momentum detection, providing traders with a unified framework for identifying high-probability market opportunities across all timeframes. By integrating two powerful oscillators with advanced confluence analysis, this indicator delivers precise entry and exit signals while filtering out market noise through sophisticated threshold-based regime detection.
🔶 Volume-Weighted Money Flow Analysis
Utilizes an advanced money flow calculation that tracks volume-weighted price movements to identify institutional activity and smart money flow. This approach provides superior signal quality by emphasizing high-volume price movements while filtering out low-volume market noise.
// Volume-weighted flows
up_volume = price_up ? volume : 0
down_volume = price_down ? volume : 0
// Money Flow calculation
up_vol_sum = ta.sma(up_volume, mf_length)
down_vol_sum = ta.sma(down_volume, mf_length)
total_volume = up_vol_sum + down_vol_sum
money_flow_ratio = total_volume > 0 ? (up_vol_sum - down_vol_sum) / total_volume : 0
🔶 Enhanced Hyper Wave Oscillator
Features a sophisticated MACD-based momentum oscillator with advanced normalization techniques that adapt to different price ranges and market volatility. The system uses percentage-based calculations to ensure consistent performance across various instruments and timeframes.
// Enhanced MACD-based oscillator
fast_ma = ta.ema(src, hw_fast)
slow_ma = ta.ema(src, hw_slow)
macd_line = fast_ma - slow_ma
signal_line = ta.ema(macd_line, hw_signal)
// Proper normalization using percentage of price
price_base = ta.sma(close, 50)
macd_normalized = macd_line / price_base
hyper_wave = macd_range > 0 ? macd_normalized / macd_range : 0
🔶 Multi-Factor Confluence System
Implements an intelligent confluence scoring mechanism that combines signals from both oscillators to identify high-probability trading opportunities. The system assigns strength scores based on multiple confirmation factors, significantly reducing false signals.
🔶 Fixed Threshold Levels
Uses predefined threshold levels optimized for standard oscillator ranges to distinguish between normal market fluctuations and significant momentum shifts. The dual-threshold system provides clear visual cues for overbought/oversold conditions while maintaining consistent signal criteria across different market conditions.
🔶 Overflow Detection Technology
Advanced overflow indicators identify extreme market conditions that often precede major reversals or continuation patterns. These signals highlight moments when market momentum reaches critical levels, providing early warning for potential turning points.
🔶 Dual Oscillator Integration
The indicator simultaneously tracks volume-weighted money flow and momentum-based price action through two independent oscillators. This dual approach ensures comprehensive market analysis by capturing both institutional activity and technical momentum patterns.
// Multi-factor confluence scoring
confluence_bull = (mf_bullish ? 1 : 0) + (hw_bullish ? 1 : 0) +
(mf_overflow_bull ? 1 : 0) + (hw_overflow_bull ? 1 : 0)
confluence_bear = (mf_bearish ? 1 : 0) + (hw_bearish ? 1 : 0) +
(mf_overflow_bear ? 1 : 0) + (hw_overflow_bear ? 1 : 0)
confluence_strength = confluence_bull > confluence_bear ? confluence_bull / 4 : -confluence_bear / 4
🔶 Intelligent Signal Generation
The system generates two tiers of reversal signals: strong signals that require multiple confirmations across both oscillators, and weak signals that identify early momentum shifts. This hierarchical approach allows traders to adjust position sizing based on signal strength.
🔶 Visual Confluence Zones
Background coloring dynamically adjusts based on confluence strength, creating visual zones that immediately communicate market sentiment. The intensity of background shading corresponds to the strength of the confluent signals, making pattern recognition effortless.
🔶 Threshold Visualization
Color-coded threshold zones provide instant visual feedback about oscillator positions relative to key levels. The fill areas between thresholds create clear overbought and oversold regions with graduated color intensity.
🔶 Candle Color Integration
Optional candle coloring applies confluence-based color logic directly to price bars, creating a unified visual framework that helps traders correlate indicator signals with actual price movements for enhanced decision-making.
🔶 Overflow Alert System
Specialized circular markers highlight extreme overflow conditions on both oscillators, drawing attention to potential climax moves that often precede significant reversals or accelerated trend continuation.
🔶 Customizable Display Options
Comprehensive display controls allow traders to toggle individual components on or off, enabling focused analysis on specific aspects of the indicator. This modularity ensures the indicator adapts to different trading styles and analytical preferences.
1 Week
1 Day
15 Min
This indicator provides a complete analytical framework by combining volume analysis with momentum detection in a single, coherent system. By offering multiple confirmation layers and clear visual hierarchies, it empowers traders to identify high-probability opportunities while maintaining precise risk management across all market conditions and timeframes. The sophisticated confluence system ensures that signals are both timely and reliable, making it an essential tool for serious technical analysts.
